Softwares Description
Kabu Viewer
![]()
What is Kabu Viewer ?
Kabu Viewer is an analysis tool thet help to handle data "*.csv" files generated by SERMA tool called Ruiyu. It is also possible to generate data "*.csv" files on this web site with MK2 Report tool. This last tool generate a link which is send to the customer instead of sending a zipped file of "*.csv" data. This link to the rawdata folder on the server is needed for Kabu Viewer to operate properly.
This I/V curve viewer help to handle in a very simple way every data sent to customer after HBM (Human Body Model), MM (Machine Model) et CDM (Charged Device Model) tests.
Kabu Viewer start window (a) : enter a link and proceed. Optionally, specify a second link/or path to second zip file for comparison purposes. Then choose the zip file to analyse (b).
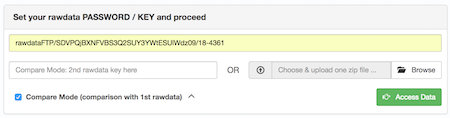
(a)
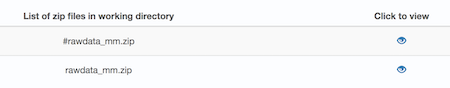
(b)
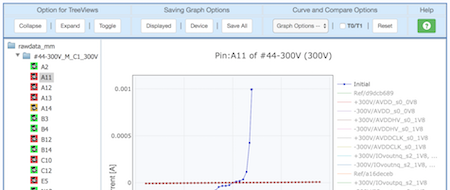
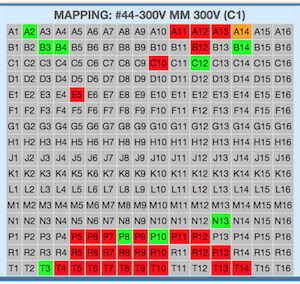
Below are some exemples of the tool (curves and mapping) :
Find & Replace
 What is Find & Replace?
This software help you do a search in the uploaded file. Compatible file extentions: *.xml; *.html; *.txt or *.rtf.
As exemple, this help to modify all recurences of a word or sentence in the complete uploaded document and returns the updated file to the user.
Orion3 to Nami
![]()
What is Orion3 to Nami ?
This software generate several Nami ".txt" files from automatic waveform captured by Orion3 as follows:
- Modules Auto Average (MAA): allows to handle files from automatic MODULE CALIBRATION. This option will render zip files containing averages from each calibration level. Device name type => #small_C_C1.result.xml
- Simple Pulses Splits (SPS): allows to simply split files from automatic TESTED DEVICES. This option will render zip files with each pin tested.Device name type => #77_C_C1_500V.result.xml
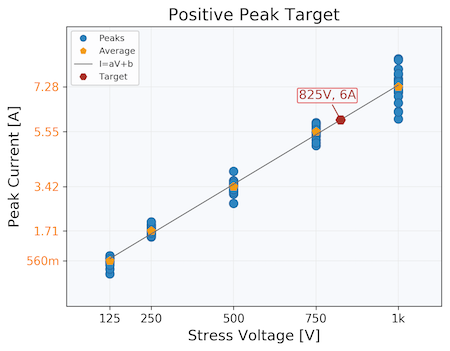
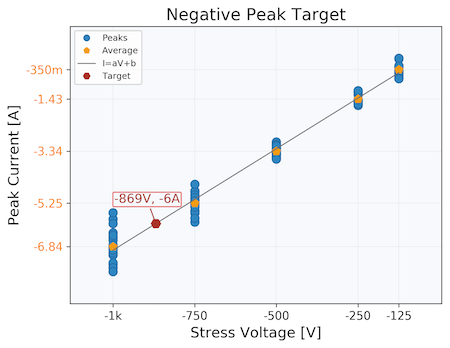
- Peak Current Station (PCS): allows to get average of PEAK CURRENT on stress levels and render a voltage corresponding to a specific customer target current (Peak graphs are generated). Device name type => #77_C_C1_500V.result.xml
Aditionnal feature for handeling manual scope waveform capture:
- Simple TXT to Images (STI): allows to generate images of each pulse from a .TXT file (recorded directly from the scope). Device name type => F1_C3ansi_neg_small_125V00#123-SMI180#A11.txt (where "123-SMI180" is the device name and "A11" the tested pin).
- Peak Current TXT (PCT): allows to get average of PEAK CURRENT on stress levels and render a voltage corresponding to a specific customer target current (Peak graphs are generated). Device name type => #77_C_C1_500V.result.xml
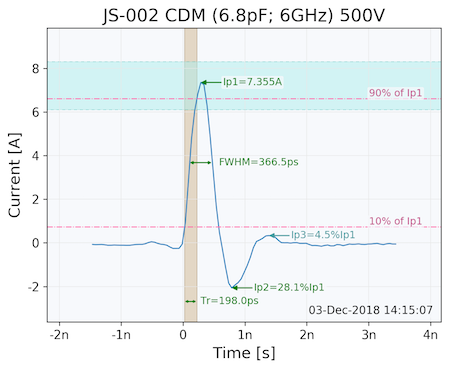
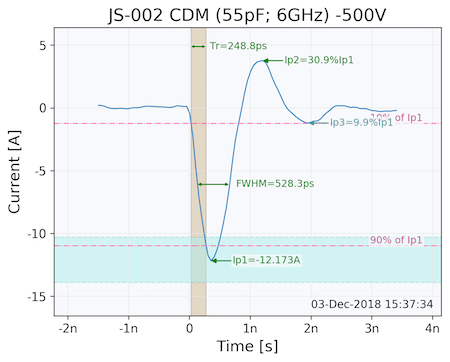
Below are some examples of image curves genereted by this tool :
 |
 |
 |
 |
Only an Administrator user has the right to update the standars values.